Prouducts


 Contant
 3nh / Sineimage Reflective/Transparent YE0175 Streaking Meas
3nh / Sineimage Reflective/Transparent YE0175 Streaking Measurement Test Chart for the disturbance
The YE0175 is designed for measurement of the disturbance caused by the video level in black areas to the right of or below the areas. Horizontal white lines are positioned on a black background.
Definition of streaking measurements
Measurement of the disturbance caused by the video level in black areas to the right of or below the areas.The disturbance is characterized by measuring the duration of the delay before the video level corresponding to the normal video level of the black is restored.
Measuring equipment
Video level meter; B/W monitor, oscilloscope, low-pass filter: 500 KHz
Measurement conditions
The chart illumination must be adjusted so that the white bars give a signal of 100% with average iris setting.
Gain: 0dB
Gamma corrector: OFF
Contour corrector: OFF
Knee corrector: OFF
Pedestal = 5% of nominal video level (= 35 mV)
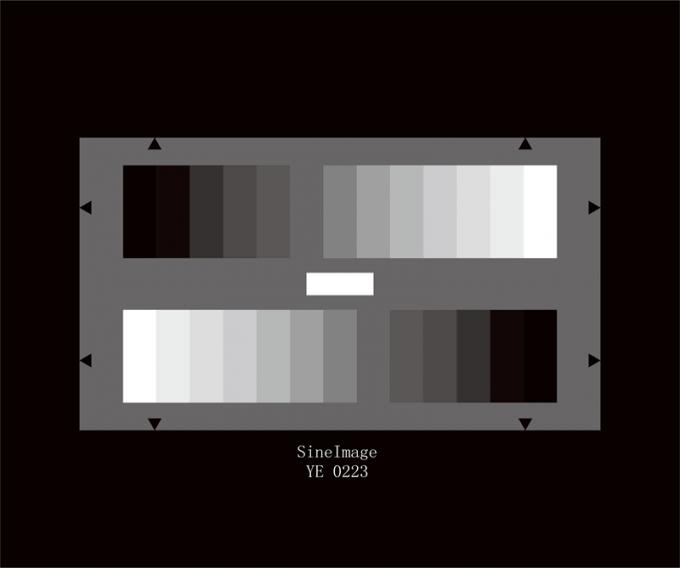
The values of the 11-graduated gray scale are as follows:
| Step | Density | Reflectance in % |
| 1 | 0.05 | 89 |
| 2 | 0.13 | 74 |
| 3 | 0.22 | 60 |
| 4 | 0.32 | 48 |
| 5 | 0.43 | 37 |
| 6 | 0.55 | 28 |
| 7 | 0.69 | 20 |
| 8 | 0.88 | 13 |
| 9 | 1.06 | 8 |
| 10 | 1.31 | 5 |
| 11 | 1.65 | 2 |
The density values are based on BaSo4 = 0. Two black fields and a white field are located between the gray scales, the density of the black filed is D > 2.4 (reflectance < 0.5 %). The density of the white filed is D = 0.05 (reflectance = 89.9 %).