 Prouducts


 Contant
 Sineimage SFRplus Test Chart Large LVT Film Test Chart Trans
Sineimage SFRplus Test Chart Large LVT Film Test Chart Transparent to measure MTF, lateral chromatic aberration, distort
Sineimage SFRplus Large LVT Film Test Chart Transparent
| Model | SFRplus |
| Type | Transparent |
| Format | Custom Designs |
| Size | 30.48 cm x 50.8 cm |
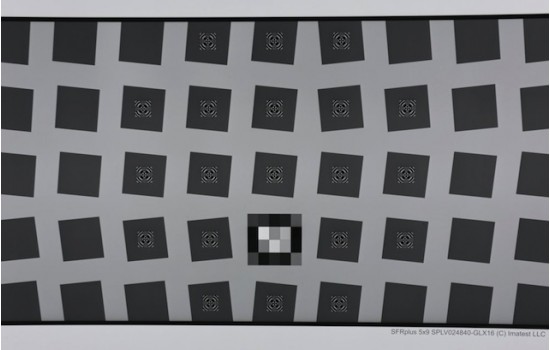
This transmissive (backlit) SFRplus test chart can be used with the Imatest SFRplus module to measure MTF, lateral chromatic aberration, distortion, and tonal response. The SFRplus module features fully automated region-of-interest detection.
The SFRplus test chart offers significant advantages over commonly used charts such as the ISO 12233 chart, including much less wasted area, the ability to produce a map of sharpness over the sensor surface, better measurement accuracy due to the lower contrast, and full support for automated testing.
Size
This chart has an active chart area of 48.3 cm x 26.81 cm (19 in x 10.56 in) in a total film size of 30.48 cm x 50.8 cm (12 in x 20 in). Bar-to-bar height is 252 mm (9.92 in).
This chart is produced with a high-precision, black and white, LVT film recording process for the best possible density range, low noise, and fine detail. The edges have an MTF50 >= 10 cycles/mm, which is about 2 times better than the best inkjet charts. For more information please take a look at our transmissive chart quality comparison! The large patterns are fine enough to produce good results with up to 30 megapixel cameras.
Standard Version
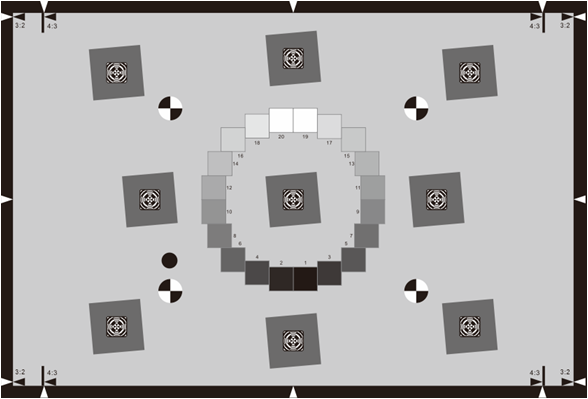
This chart, which has a 3:2 aspect ratio, is a "no-frills" implementation of the standard. For most work we recommend the Enhanced or Extended charts, which have additional edges for measuring performance near the image boundaries, as well as hyperbolic wedges and color patches (where the technology allows). These chartsmaintain full compliance with the standard.
The Imatest Standard ISO 12233:2014 E-SFR chart closely resembles the Low contrast E-SFR test chart illustrated in section 6.1 and Annex C of the ISO standard document, with a few differences, all of which are fully compliant with the ISO standard.
- A 20 patch OECF grayscale pattern* is used instead of the 16 patch version.
- The Focus Patterns in the centers of the squares are rectangular (to increase the MTF measurement area) and are designed to reduce interference with automatic edge detection.
- There are four registration marks instead of three to facilitate automated region detection. (Four features are required for a projective transform.)
- An additional mark above the lower-left registration mark is used for detecting chart orientation.
Enhanced Version
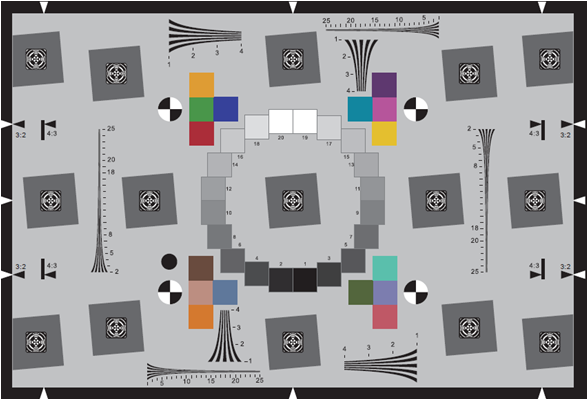
The Imatest Enhanced ISO 12233:2014 E-SFR chart has all the features of the Standard chart, keeping the 3:2 aspect ratio, with the addition of six added slanted squaresfor measuring performance near the image boundaries and hyperbolic wedges for visual analysis or analysis with the Imatest Wedge module. It also has 16 color patches when produced with technologies that allow color. Since these additions are in regions of the chart not covered by the standard, compliance with the standard is unaffected.
The differences between the Imatest charts and the chart illustrated in the standard are listed below. Even with these differences the Imatest chart is in full compliance with the standard.
- A 20 patch OECF grayscale pattern* is used as opposed to the 16 patch version.
- The Focus Patterns in the centers of the squares are rectangular (to increase the MTF measurement area) and are designed to reduce interference with automatic edge detection.
- There are four registration marks instead of three to facilitate automated region detection. (Four features are required for a projective transform.)
- An additional mark above the lower-left registration mark is used for detecting chart orientation.
The differences between the Enhanced and Standard Versions are as follows:
- Six extra slanted squares are added for measuring performance near the image boundaries.
- Several hyperbolic wedges with spatial frequencies, similar to the CIPA chart referenced in the ISO standard, for visual analysis or use with the Imatest Wedge module.
- 16 color patches when produced with technologies that allow color (inkjet or color LVT), with colors similar to the industry-standard 24-color test chart.
This chart will work with the fully-automated eSFR ISO module.
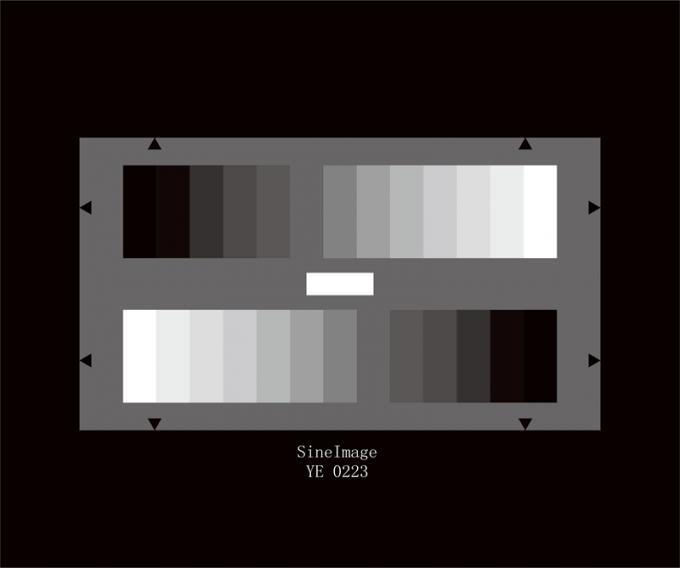
The values of the 11-graduated gray scale are as follows:
| Step | Density | Reflectance in % |
| 1 | 0.05 | 89 |
| 2 | 0.13 | 74 |
| 3 | 0.22 | 60 |
| 4 | 0.32 | 48 |
| 5 | 0.43 | 37 |
| 6 | 0.55 | 28 |
| 7 | 0.69 | 20 |
| 8 | 0.88 | 13 |
| 9 | 1.06 | 8 |
| 10 | 1.31 | 5 |
| 11 | 1.65 | 2 |
The density values are based on BaSo4 = 0. Two black fields and a white field are located between the gray scales, the density of the black filed is D > 2.4 (reflectance < 0.5 %). The density of the white filed is D = 0.05 (reflectance = 89.9 %).
