 Prouducts


 Contant
 The International Organization for Standardization published a revision of “ISO 12233 Photography — Electronic still picture imaging — Resolution and spatial frequency responses” in February 2014.
The old version of the standard defined a high contrast test chart that is widely used in the industry. However when this chart is used to determine the spatial frequency response using the high contrast slanted edges, the results sometimes look very strange and do not compare to the real resolution which means the ability of a camera to capture fine details of a scene.
There are two reasons for this behavior. The one reason is that the chart is a high contrast one and often causes clipping in the highlights and shadows, which leads to a misinterpretation of the edge. The second reason is that if an edge is sharpened or compressed, the edge spread function that is analyzed for the spatial frequency response (SFR) is modified and does not represent the resolution anymore.
Here is an example:
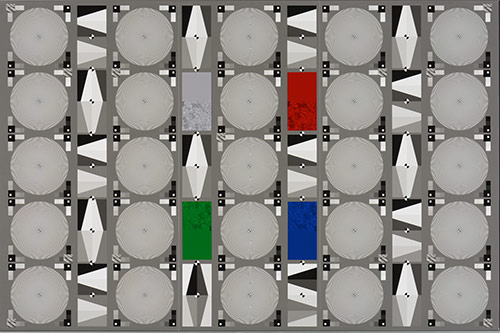
TE268

Siemens star analysis of the original image.
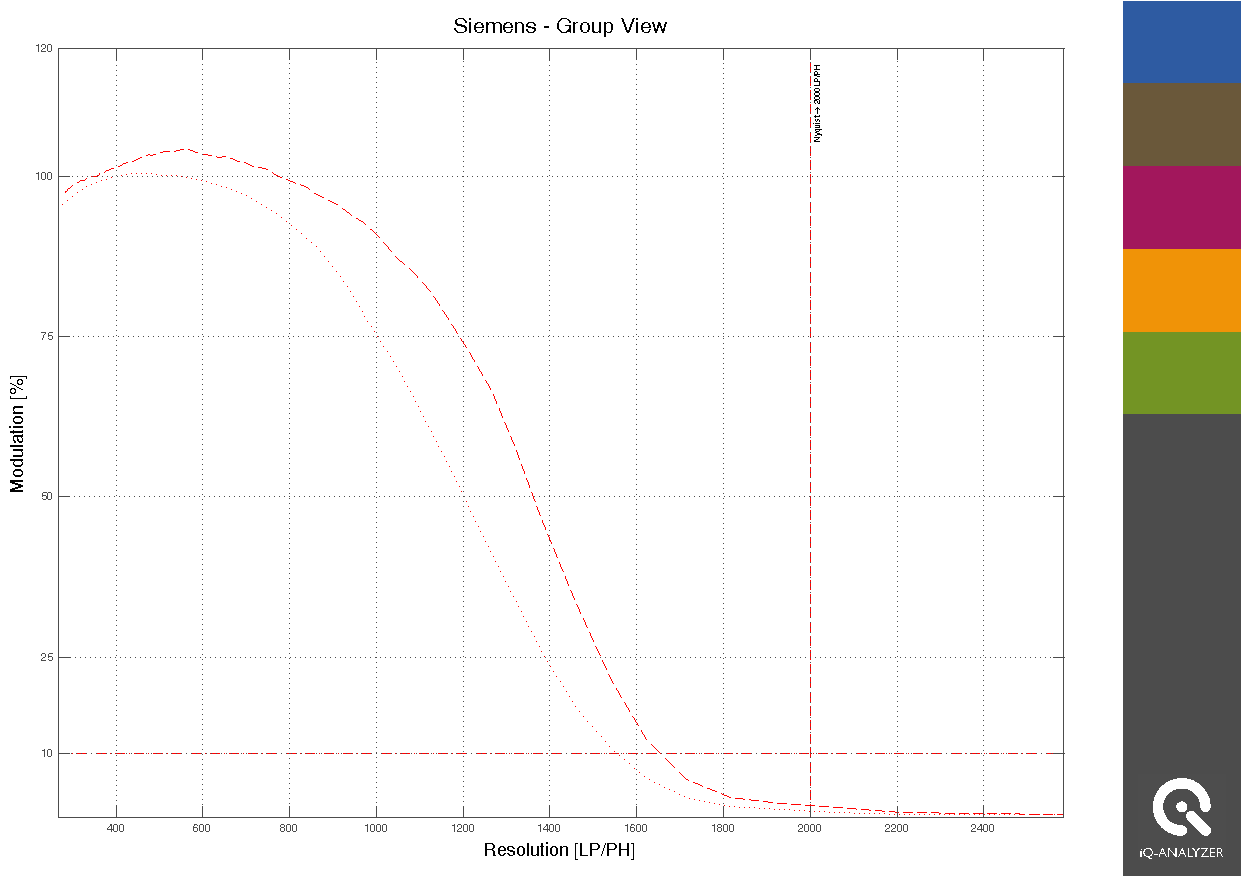 Siemens star analysis of the sharpened image.
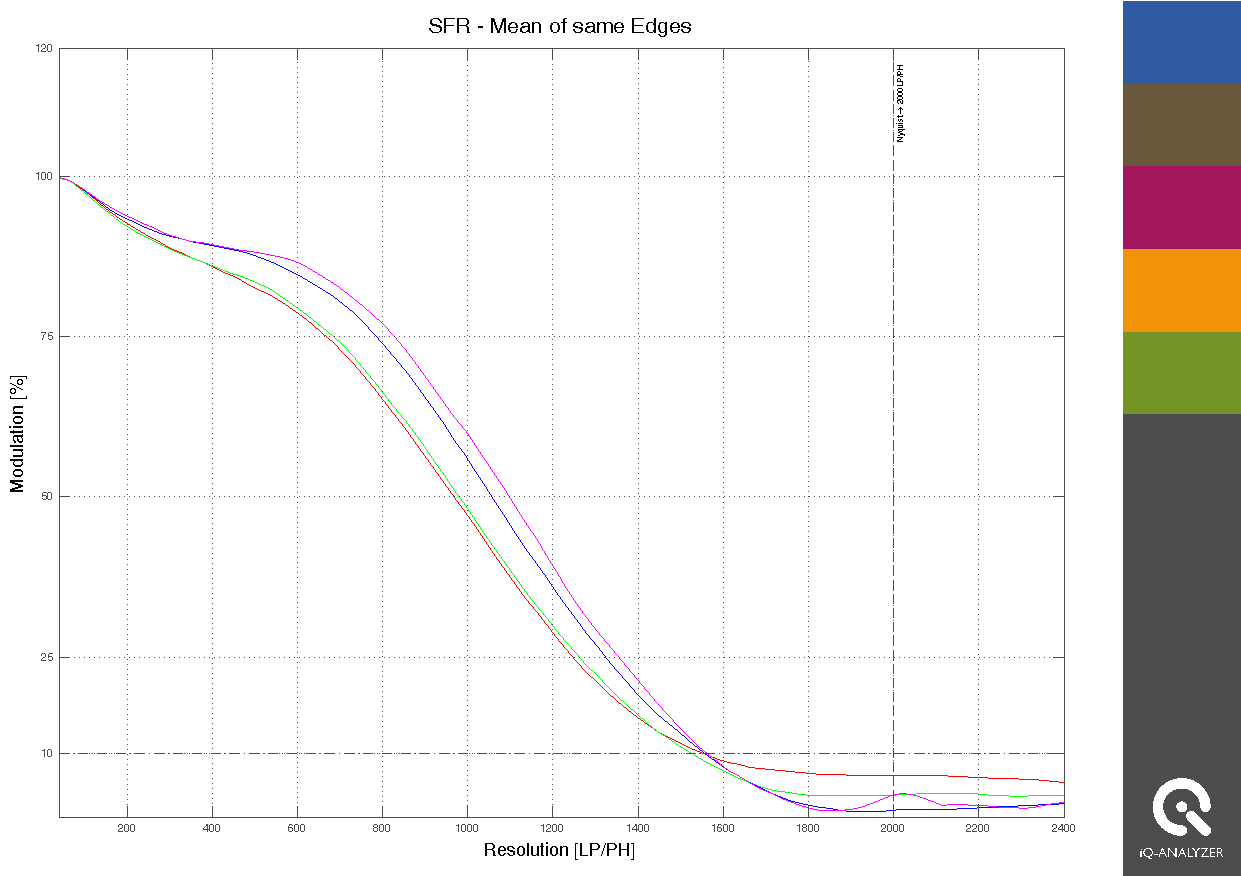
Slanted edge analysis of the original image.
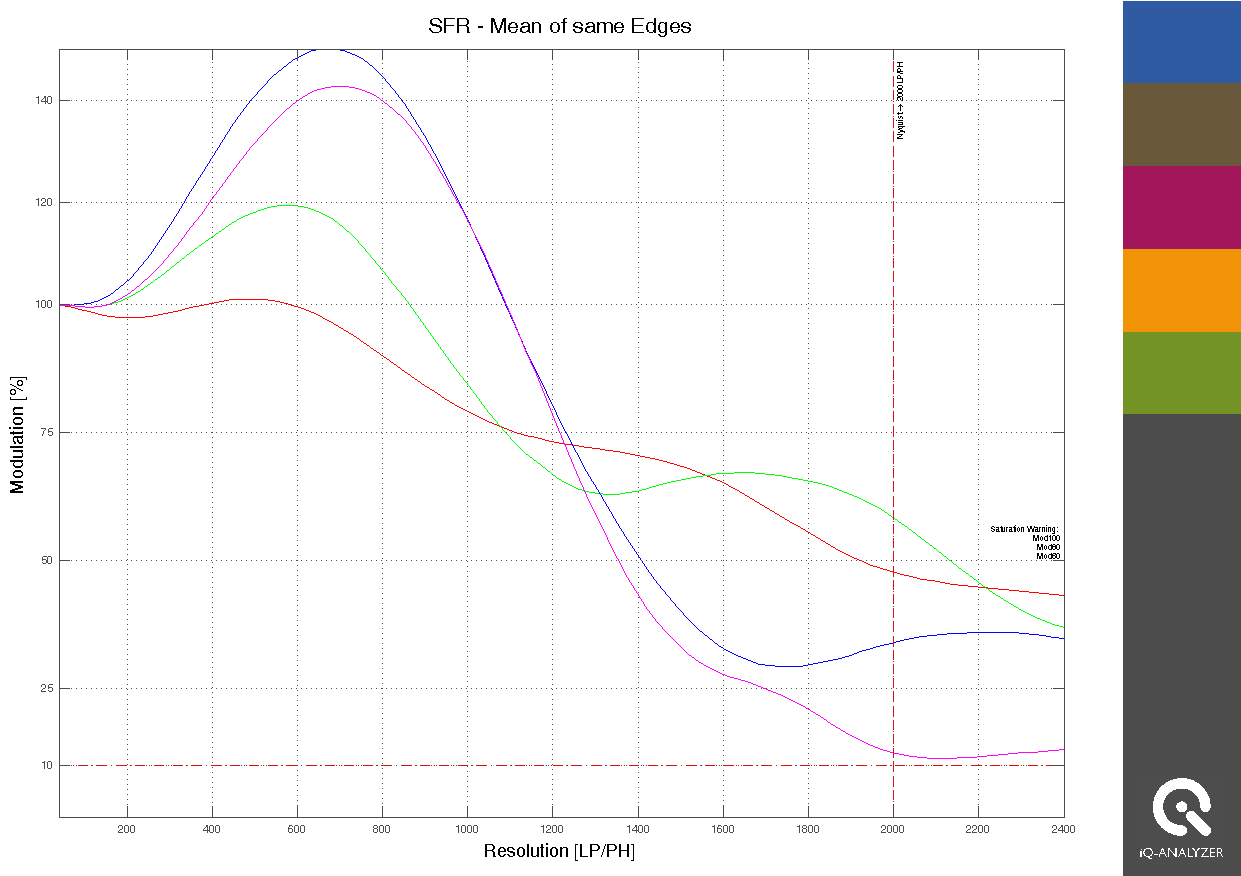
Slanted edge analysis of the sharpened image.
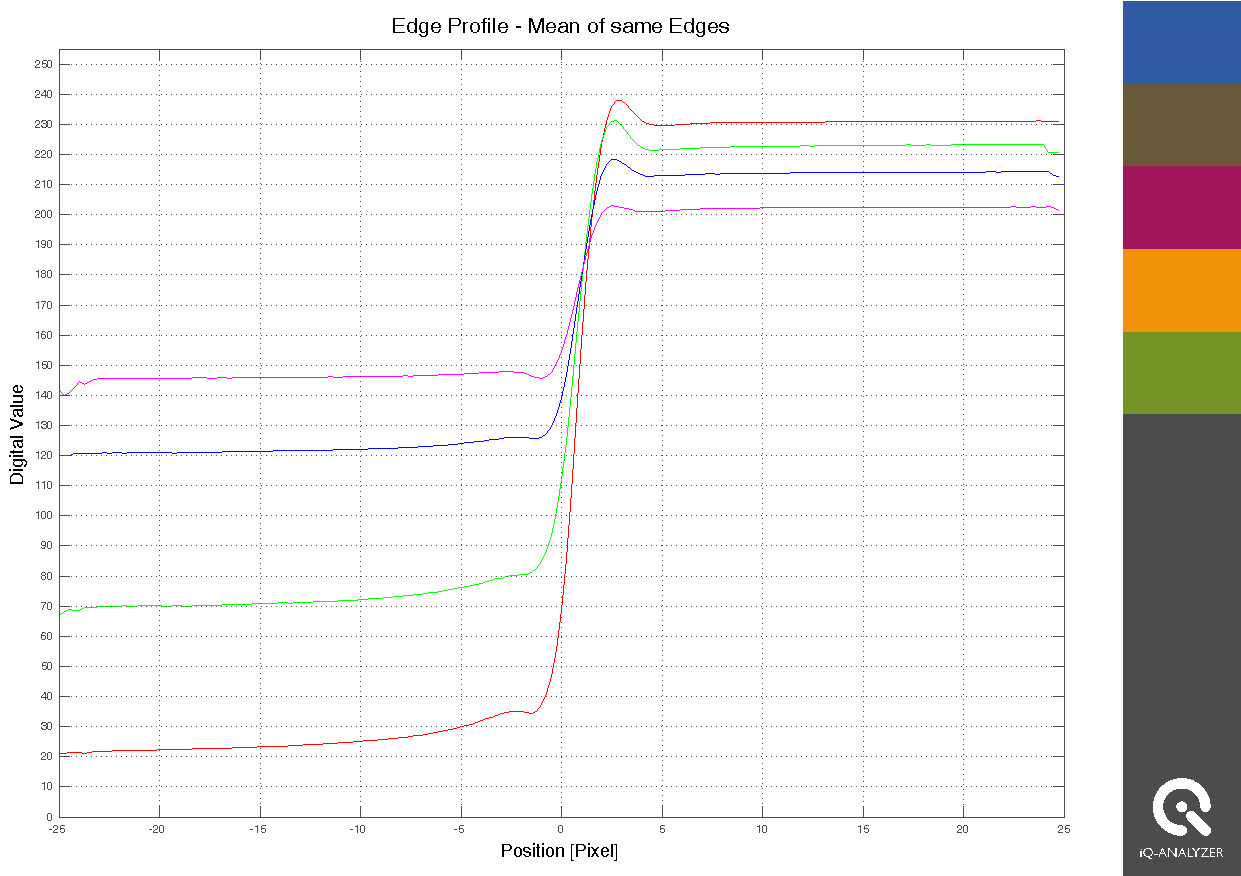
Slanted edge profile of the original image.
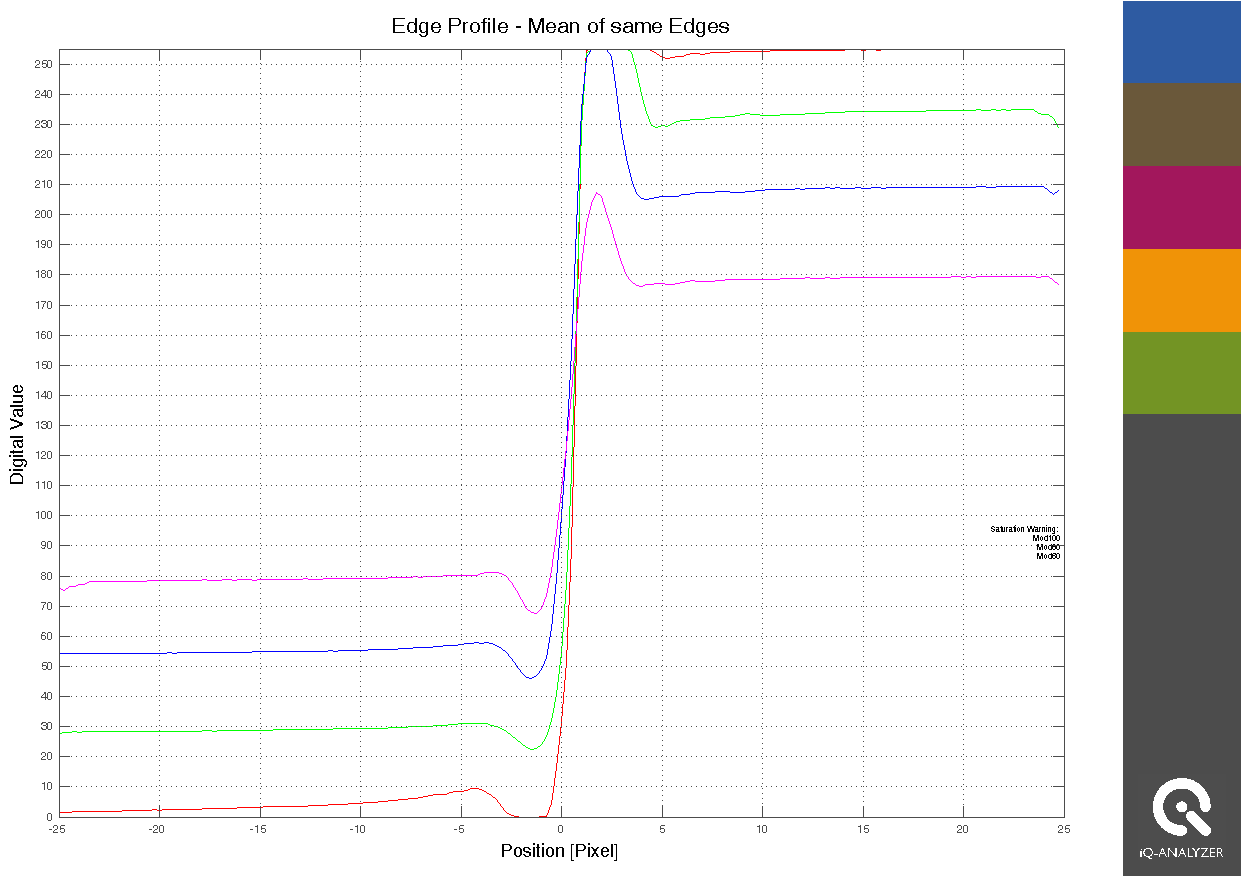
Slanted edge analysis of the sharpened image.
The image of our TE268 chart, which includes slanted edges at different contrast levels as well as Siemens stars, was captured and saved with a camera. It was then opened and sharpened in Photoshop to make sure that all data has the same origin.
As can be seen from the graphs, the unsharpened but already processed image provides similar results for the slanted edge and the Siemens star with a limiting resolution (10% Threshold) at around 1600 LP/PH.
The analysis of the sharpened image shows that the analysis of the Siemens star makes sense because the curve has the typical shape of a sharpened image but the limiting resolution is only slightly higher than for the original image. This is because the Siemens star is analyzed frequency by frequency. The analysis of the sharpened edge however shows very strange results and limiting resolutions beyond the Nyquist limit. That is because the edge-spread function has been changed by the sharpening of the edge and cannot be used for describing the resolution anymore.
Conclusion
The slanted edge and the Siemens star can both be used to measure the resolution of a camera on unsharpened and uncompressed images. In this case the slanted edges can have advantages because they can also be used for edge- width-analysis which is important to describe blur and therefore for testing image stabilization.
If, on the other hand, a camera processes the images with a significant amount of sharpening or high compression rates and this function cannot be turned off, the Siemens star with the related analysis method developed by Image Engineering, together with the University of Cologne, is the right structure to use. Both methods are described in the new revision of the ISO standard and the contrast of the edges to be used has been decreased to make the edges less sensitive to sharpening and clipping.
The article is from https://www.image-engineering.de/
